Cell phones constantly communicate with cellular towers, transmitting radio frequency signals even when you’re not actively making calls. These transmissions create electromagnetic signatures detectable by spectrum analyzers.
Whether you’re securing a sensitive facility, enforcing no-phone policies in testing environments, troubleshooting wireless interference, or conducting technical surveillance countermeasures, spectrum analyzers provide powerful tools for detecting and analyzing cellular device activity.
Understanding how to properly configure and interpret spectrum analyzer readings transforms this professional RF equipment into an effective cell phone detection system.
Understanding Cell Phone RF Signatures
Cell phones operate across multiple frequency bands, each corresponding to different cellular technologies. Modern smartphones support numerous bands simultaneously, switching between them based on network availability and signal strength.
Major cellular frequency bands in North America:
- 2G GSM: 850 MHz and 1900 MHz (being phased out)
- 3G UMTS/CDMA: 850 MHz, 1700/2100 MHz, 1900 MHz (largely deprecated)
- 4G LTE: Multiple bands from 600 MHz to 2600 MHz
- 5G: Low-band (600-900 MHz), mid-band (2.5-3.7 GHz), high-band mmWave (24-47 GHz)
Common LTE bands to monitor:
- Band 2: 1850-1910 MHz (uplink), 1930-1990 MHz (downlink)
- Band 4: 1710-1755 MHz (uplink), 2110-2155 MHz (downlink)
- Band 5: 824-849 MHz (uplink), 869-894 MHz (downlink)
- Band 12: 699-716 MHz (uplink), 729-746 MHz (downlink)
- Band 13: 777-787 MHz (uplink), 746-756 MHz (downlink)
- Band 66: 1710-1780 MHz (uplink), 2110-2200 MHz (downlink)
Cell phones transmit on uplink frequencies and receive on downlink frequencies. For detection purposes, focus on uplink bands where the phone actively transmits signals toward cell towers.
Types of Spectrum Analyzers for Cell Phone Detection
Different spectrum analyzer types suit different detection scenarios and budgets.
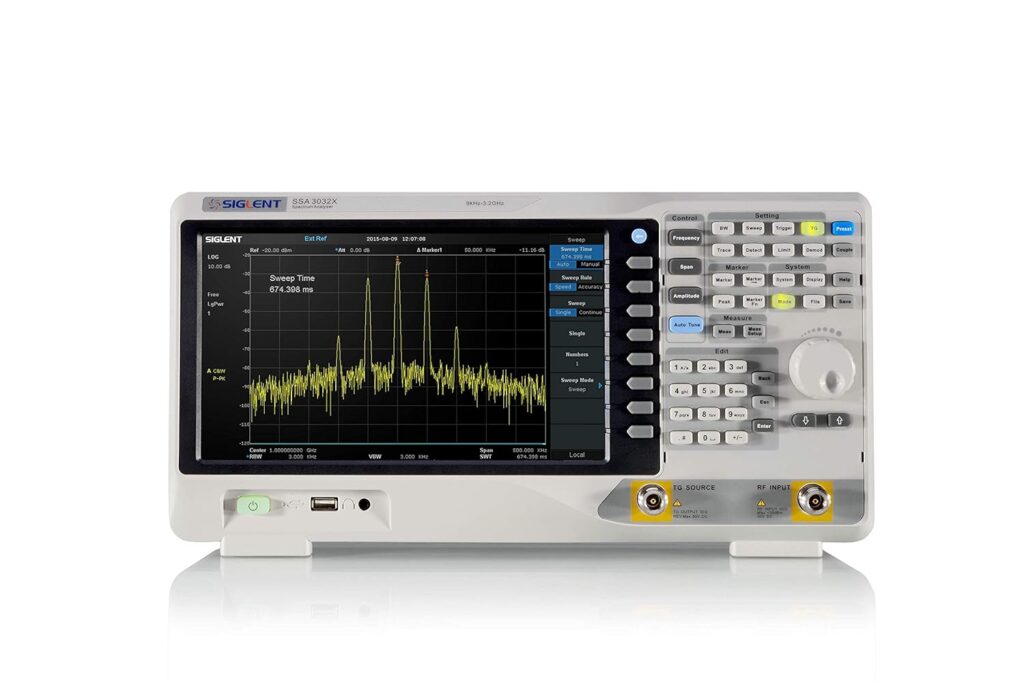
Benchtop spectrum analyzers:
- Professional-grade lab equipment
- Excellent sensitivity and dynamic range
- Wide frequency coverage (typically 9 kHz to 6 GHz or higher)
- High resolution bandwidth settings for detailed analysis
- Expensive ($5,000 to $50,000+)
- Require AC power and aren’t portable
- Best for: Laboratory testing, detailed signal analysis, R&D work
Handheld spectrum analyzers:
- Portable RF analysis tools
- Battery powered for field use
- Frequency coverage typically DC to 3 GHz or 6 GHz
- Good sensitivity for most detection applications
- Moderate cost ($1,500 to $10,000)
- Built-in antennas or external antenna connections
- Best for: Field surveys, TSCM work, facility security checks
USB spectrum analyzers:
- Connect to laptop or computer
- Software-defined interface
- Lower cost ($300 to $2,000)
- Frequency coverage varies by model
- Portability depends on laptop
- Sensitivity adequate for close-range detection
- Best for: Budget-conscious applications, educational use, basic monitoring
Real-time spectrum analyzers:
- Capture transient signals that standard analyzers miss
- Essential for detecting sporadic cell phone transmissions
- Display signal activity over time in waterfall or spectrogram views
- Higher cost but critical for reliable detection
- Best for: Professional TSCM, security applications requiring high confidence
For cell phone detection, prioritize real-time or near-real-time analysis capabilities. Cell phones transmit in bursts rather than continuously, so standard swept spectrum analyzers might miss brief transmission events.
Essential Spectrum Analyzer Settings
Proper configuration determines detection success. Incorrect settings cause missed detections or false positives.
Frequency span:
- Set span to cover relevant cellular bands for your region
- For comprehensive detection, scan 700 MHz to 2.7 GHz (covers most LTE/5G)
- Narrower spans provide faster scan rates and better temporal resolution
- For specific carrier detection, focus on known carrier frequency allocations
Resolution bandwidth (RBW):
- Determines analyzer’s frequency selectivity
- Wider RBW (100 kHz to 1 MHz): Faster scans, less sensitive, good for strong signals
- Narrower RBW (10 kHz to 30 kHz): Better sensitivity, slower scans, resolves weak signals
- For cell phone detection, start with 100 kHz RBW for initial surveys
- Reduce to 30 kHz when investigating specific signals
Video bandwidth (VBW):
- Filters noise from displayed traces
- Set VBW equal to or less than RBW
- Lower VBW smooths traces but may miss fast transients
- For cell phone detection, VBW = RBW often works well
Sweep time:
- Time analyzer takes to scan frequency span
- Faster sweeps (shorter sweep time) catch more transient signals
- Auto sweep mode usually works, but manual control helps for specific scenarios
- Balance between sensitivity (longer sweeps) and catching brief transmissions (faster sweeps)
Detection mode:
- Positive peak detection: Shows maximum signal levels, best for detecting transmissions
- Sample detection: Shows actual signal samples, more accurate but may miss peaks
- Average detection: Reduces noise, useful after identifying signals
- Use positive peak detection for initial cell phone detection work
Reference level:
- Maximum power level displayed on screen
- Set high enough that signals aren’t clipped
- Start at 0 dBm, adjust down if signals saturate
- Adjust up if signals are too weak to see clearly
Attenuation:
- Input attenuator reduces signal strength before analyzer processing
- Prevents strong signals from overloading front-end circuitry
- Start with 10 dB attenuation for general detection
- Reduce attenuation (0 dB) for maximum sensitivity to weak signals
- Increase attenuation if detecting very close, powerful transmitters
Detecting Active Cell Phone Transmissions
Cell phones don’t transmit constantly. Understanding transmission patterns helps you recognize cellular activity.
When cell phones transmit:
- Initial network registration when powered on
- Periodic location updates (every few minutes)
- During active calls
- Sending/receiving text messages
- Data usage (apps, browsing, streaming)
- Background app activity and push notifications
Transmission characteristics to look for:
Registration bursts:
- Brief, strong signal when phone first connects to network
- Lasts 1-3 seconds
- Appears across multiple frequency channels
- Indicates phone powering on or regaining signal
Location update transmissions:
- Short bursts every 5-15 minutes (varies by carrier)
- Even idle phones transmit these
- Weaker than active call transmissions
- Appear as brief spikes on waterfall display
Active call signatures:
- Continuous transmission throughout call duration
- Strong, sustained signal
- Hops between frequency channels (frequency hopping)
- Most obvious and easiest to detect
Data transmissions:
- Bursty, irregular patterns
- Intensity varies with data rate
- Modern LTE/5G data is nearly continuous during active use
- Appears as varying-intensity blocks on waterfall display
Set up for detection:
- Configure analyzer to cover cellular uplink bands
- Enable max hold or waterfall display to capture transient signals
- Use positive peak detection mode
- Set appropriate sweep time to catch brief transmissions (typically auto mode works)
- Position antenna for maximum coverage of detection area
Identify cell phone signals:
- Look for signals that appear and disappear (not continuous like broadcast stations)
- Check if signals appear in known cellular frequency bands
- Verify signals show characteristic burst patterns
- Strong signals that fade indicate mobile device (as person moves)
- Multiple correlated signals across different bands suggest single device
Using Directional Antennas for Localization
Omnidirectional antennas detect cell phones but don’t indicate direction or location. Directional antennas enable pinpointing device locations.
Directional antenna types:
Yagi antennas:
- Highly directional (narrow beamwidth)
- Good gain (10-15 dBi typical)
- Lightweight and portable
- Excellent for precise localization
- Available for specific frequency bands
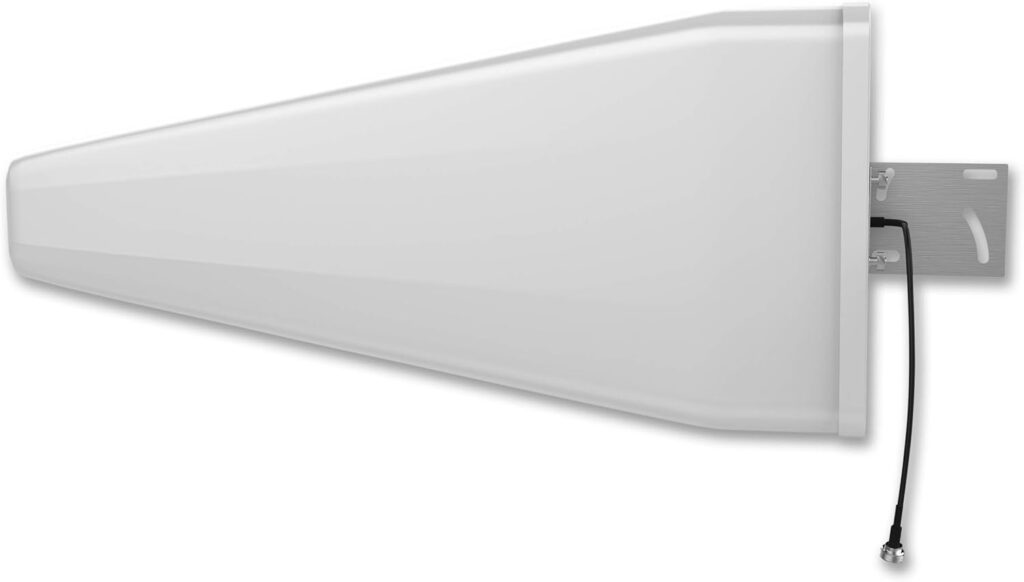
Log-periodic antennas:
- Moderate directionality
- Wideband coverage (covers many cellular bands simultaneously)
- Good compromise between directionality and frequency coverage
- Popular for TSCM work
Horn antennas:
- Moderate to high directionivity
- Clean patterns with low sidelobes
- Can cover multiple cellular bands
- Bulkier than Yagi or log-periodic designs
Directional detection procedure:
- Connect directional antenna to spectrum analyzer
- Configure analyzer for cellular uplink frequencies
- Enable max hold or waterfall mode to capture transient transmissions
- Slowly rotate antenna in horizontal plane (sweep 360 degrees)
- Note angles where signal strength peaks
- Signal is strongest when antenna points toward transmitting phone
- Take multiple bearings from different locations for triangulation
Triangulation for precise location:
- Take bearing from position A (note compass direction of strongest signal)
- Move to position B (50-100 feet away)
- Take bearing from position B
- Plot bearings on map or floor plan
- Cell phone location is near bearing intersection point
- Third bearing from position C improves accuracy
This technique works well in open areas. Indoor environments with reflections and multipath require more measurements and careful interpretation.
Creating a Baseline Spectrum Survey
Establishing a baseline of normal RF environment helps you identify anomalous cell phone activity.
Conduct baseline survey:
- Configure spectrum analyzer for full cellular band coverage
- Perform scan when you know no unauthorized phones are present
- Use max hold to capture all signals over several minutes
- Save baseline trace to analyzer memory or export to computer
- Document date, time, location, and conditions of baseline
- Repeat at different times of day to account for varying background activity
During monitoring:
- Load baseline trace for comparison
- Configure analyzer to display live trace and baseline simultaneously
- New signals appearing above baseline indicate potential cell phones
- Signals matching baseline are likely legitimate RF sources (base stations, WiFi, etc.)
- Focus investigation on signals that differ from baseline
Create baseline for multiple areas:
- Conference rooms
- Testing facilities
- Secure areas
- Each location has unique RF environment
- Baselines must be location-specific
Distinguishing Cell Phones from Other RF Sources
Many devices transmit in similar frequencies as cellular devices. Correctly identifying cell phones requires understanding signal characteristics.
WiFi signals (2.4 GHz and 5 GHz):
- Continuous or very frequent transmissions
- Appear at 2400-2483.5 MHz and 5150-5850 MHz
- Channel structure visible (20/40/80 MHz wide channels)
- Don’t show cellular burst patterns
- Much more continuous than cellular uplink
Bluetooth devices:
- 2400-2483.5 MHz (overlaps 2.4 GHz WiFi)
- Rapid frequency hopping across band
- Lower power than cell phones
- Very short range (detection only when close)
Wireless cameras and video transmitters:
- Continuous transmission when active
- Often in 900 MHz, 1.2 GHz, 2.4 GHz, 5.8 GHz bands
- Wide bandwidth (several MHz for video)
- Steady power level (not bursty like cellular)
Two-way radios:
- Transmission only when push-to-talk button pressed
- Typically narrowband (12.5 kHz or 25 kHz)
- Appear in VHF (136-174 MHz) or UHF (400-512 MHz) bands
- Much narrower than cellular signals
Key cellular identifiers:
- Appears in known cellular uplink bands (700-2700 MHz range)
- Bursty transmission pattern (not continuous)
- Moderate to wide bandwidth (1.4 MHz to 20 MHz for LTE)
- Power level varies as user moves
- Multiple transmissions across different frequency bands simultaneously
- Increases in strength/frequency during active calls or data usage
Real-Time Analysis with Waterfall Displays
Waterfall or spectrogram displays show signal activity over time, essential for detecting sporadic cell phone transmissions.
Waterfall display interpretation:
- Vertical axis: Frequency
- Horizontal axis: Time
- Color: Signal strength (typically blue/cold = weak, red/hot = strong)
- Continuous signals appear as horizontal lines
- Transient signals appear as brief colored segments
- Cell phone transmissions appear as intermittent blocks or streaks
Identify cell phone activity patterns:
Registration:
- Bright vertical band spanning multiple frequencies
- Lasts 1-3 seconds
- Occurs when phone first connects to network
Location updates:
- Brief, narrow vertical marks
- Repeats every few minutes
- Indicates idle phone maintaining network connection
Voice calls:
- Continuous horizontal band during call
- May show frequency hopping (diagonal stripes)
- Remains visible throughout call duration
Data transfers:
- Variable-intensity horizontal bands
- Intensity fluctuates with data rate
- Modern smartphones show nearly constant low-level data activity
Configure waterfall effectively:
- Set time scale appropriate for detection needs (5-60 seconds visible)
- Adjust color scale so weak signals are visible but strong signals don’t saturate
- Use sufficient RBW to see signal structure (30-100 kHz typical)
- Enable trace averaging if background noise is high
Automated Cell Phone Detection Systems
Spectrum analyzers with automation capabilities enable unattended monitoring and alerting.
Automated detection features:
Channel power monitoring:
- Configure analyzer to monitor specific cellular uplink channels
- Set threshold power level
- Trigger alert when signal exceeds threshold
- Indicates phone transmission in monitored channel
Occupied bandwidth measurement:
- Measures bandwidth of detected signals
- Cellular signals have characteristic bandwidths (1.4, 3, 5, 10, 15, 20 MHz for LTE)
- Alert when signal matches cellular bandwidth profile
Signal density triggers:
- Counts number of signals above threshold in frequency span
- Increase in signal density suggests cell phone activity
- Useful for detecting multiple phones
Time domain power triggers:
- Monitors total power in specified band
- Sustained increase indicates transmission
- Less specific than channel monitoring but simpler
External alerting:
- Many analyzers provide TTL trigger outputs
- Connect to alarm systems or recording devices
- Enable automated logging and alerting
Software automation:
- SCPI programming allows computer control of analyzer
- Create custom detection algorithms
- Log data for long-term analysis
- Generate reports and statistics
Legal and Ethical Considerations
Using spectrum analyzers for cell phone detection involves legal and ethical responsibilities.
Legal considerations:
- Spectrum analyzers are passive receivers – legal to use in most jurisdictions
- Simply receiving and analyzing RF signals is generally lawful
- Do not transmit jamming signals (illegal under FCC regulations in US)
- Do not intercept communications content (illegal without authorization)
- Detecting presence of transmissions is different from intercepting content
- Know local laws regarding RF monitoring and privacy
Ethical use cases:
- Security screening at facility entrances
- Enforcing no-phone policies during exams
- Technical surveillance countermeasures (TSCM) in sensitive areas
- Troubleshooting wireless interference
- RF safety assessments
- Research and educational purposes
Inappropriate uses:
- Stalking or surveillance of individuals without authorization
- Intercepting private communications
- Violating reasonable expectations of privacy
- Using detection to harass or intimidate
Best practices:
- Clearly post policies about phone detection in monitored areas
- Use detection only in areas where you have authority
- Focus on detection, not interception
- Protect any collected data appropriately
- Document legitimate purpose for detection activities
- Consult legal counsel for complex scenarios
Practical Detection Scenarios
Different scenarios require tailored approaches for effective cell phone detection.
Scenario 1: Conference room sweep
Objective: Verify no phones present before sensitive meeting
Procedure:
- Conduct baseline survey of empty room
- Use handheld spectrum analyzer with omnidirectional antenna
- Scan primary cellular bands (700-2700 MHz)
- Enable max hold for 2-3 minutes to catch location updates
- Ask all personnel to power on phones briefly (if authorized to test)
- Verify you can detect test phones to confirm system works
- Clear room and rescan
- Any new signals indicate unauthorized devices
Scenario 2: Continuous monitoring of secure facility
Objective: Alert security when phones are brought into restricted area
Procedure:
- Install fixed spectrum analyzer at entry point
- Use directional antennas aimed at entry area
- Configure for continuous monitoring of cellular uplink bands
- Set power threshold for alerts
- Connect to alarm system or security monitoring
- Investigate alerts in real-time
- Log all detections for security records
Scenario 3: Locating hidden phone in room
Objective: Find concealed active cell phone
Procedure:
- Use handheld analyzer with directional antenna
- Configure for cellular uplink bands
- Enable waterfall display
- If possible, trigger phone remotely (call it, send text)
- Sweep directional antenna slowly around room
- Note direction of strongest signal
- Move closer to area of strongest signal
- Narrow search area with repeated measurements
- Very close range (under 10 feet) allows precise location
Scenario 4: Testing facility security screening
Objective: Evaluate effectiveness of security screening procedures
Procedure:
- Set up spectrum analyzer near security checkpoint
- Use test phones as known transmitters
- Process test phones through screening while monitoring analyzer
- Verify detection system identifies test phones
- Measure detection range and reliability
- Test different phone models and carriers
- Document detection success rate
- Improve screening based on results
Advanced Techniques for Professional Applications
Professional TSCM and security operations benefit from advanced spectrum analysis techniques.
Direction finding with antenna arrays:
- Multiple fixed antennas at known positions
- Measure signal strength at each antenna simultaneously
- Calculate bearing using phase or amplitude comparison
- Faster and more automated than manual directional sweeps
IQ data capture and analysis:
- Modern analyzers capture in-phase/quadrature (IQ) data
- Allows detailed signal analysis including modulation type
- Verify signals match cellular modulation characteristics
- Distinguish cellular from similar-frequency non-cellular signals
Long-term monitoring and statistical analysis:
- Continuous recording over days or weeks
- Analyze patterns in phone usage
- Identify times of highest activity
- Detect anomalous usage patterns
- Support security policy development with data
Multi-band correlation:
- Cell phones often transmit on multiple bands simultaneously
- Detection across multiple bands provides higher confidence
- Reduces false positives from single-band interference
- Requires analyzer capable of monitoring multiple spans
Integration with other security systems:
- Combine RF detection with access control systems
- Correlate phone detections with entry logs
- Trigger video surveillance when phone detected
- Create comprehensive security architecture
Equipment Recommendations by Budget and Application
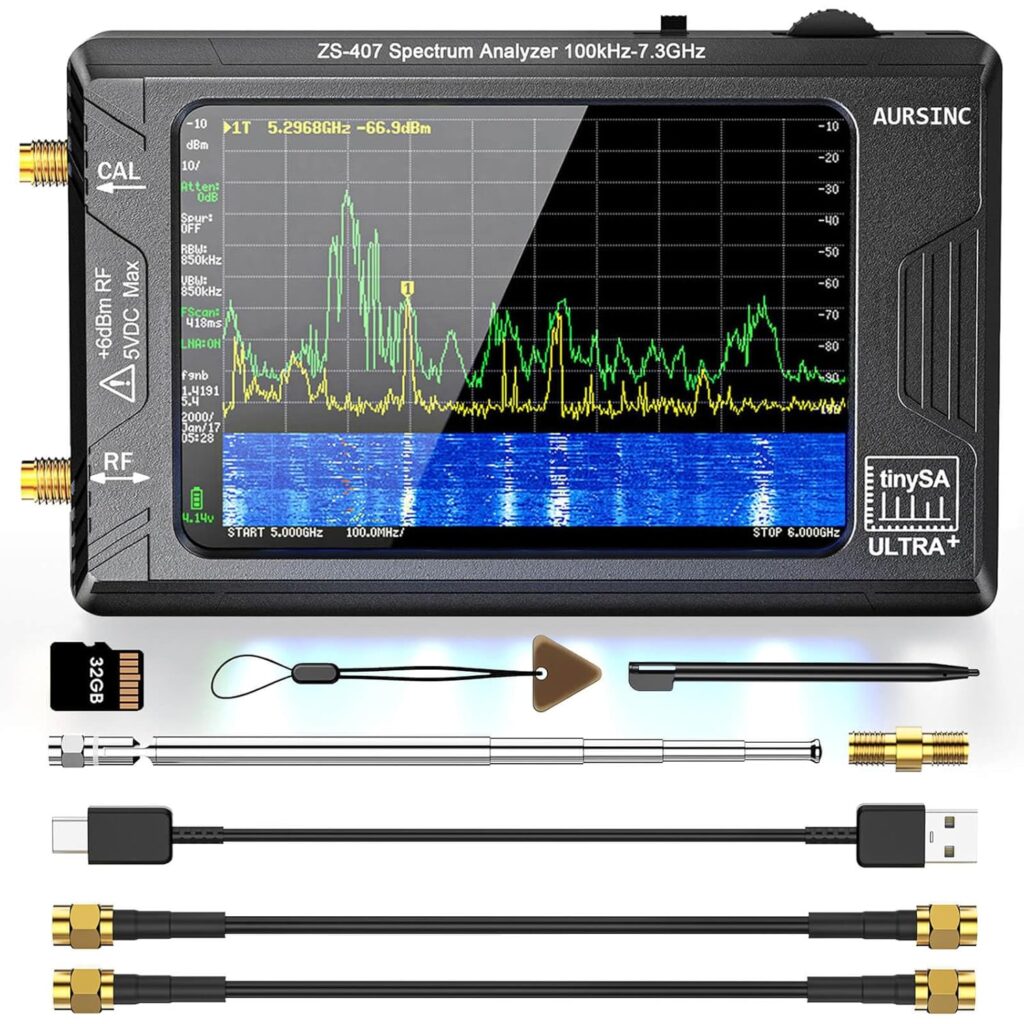
Budget option ($500-$1,500): Basic detection capability
- TinySA Ultra or similar USB spectrum analyzer
- Covers DC to 6 GHz (includes cellular bands)
- Adequate sensitivity for close-range detection (under 30 feet)
- Portable with laptop
- Best for: Learning, basic surveys, non-critical applications
Mid-range ($2,000-$8,000): Professional field work
- Handheld analyzers like RF Explorer or entry-level Keysight FieldFox
- Battery powered portability
- Good sensitivity and dynamic range
- Built-in antennas plus external antenna options
- Best for: Professional TSCM, security consultants, facility security
High-end ($10,000-$30,000): Advanced capabilities
- Professional handheld like Keysight FieldFox or Anritsu Field Master
- Real-time analysis capabilities
- Excellent sensitivity for long-range detection
- Advanced measurement functions
- Best for: Government security, critical infrastructure, advanced TSCM
Premium ($30,000+): Maximum performance
- Real-time spectrum analyzers with advanced processing
- Millisecond-level detection of transient signals
- Direction finding capabilities
- Automated detection and classification
- Best for: Military, intelligence agencies, high-security facilities
Limitations and Challenges
Understanding spectrum analyzer limitations prevents overconfidence in detection capabilities.
Detection range limitations:
- Cell phone transmission power: Typically 200 mW to 2 W
- Free space path loss reduces signal strength with distance
- Indoor environments: 30-100 feet typical detection range
- Outdoor line-of-sight: 200-500 feet possible with sensitive equipment
- Obstacles, walls, and interference reduce effective range
Phones in airplane mode:
- Airplane mode disables cellular radio
- Spectrum analyzer cannot detect phones not transmitting
- WiFi and Bluetooth may remain active even in airplane mode
- Consider complementary detection methods for non-transmitting phones
Powered-off phones:
- Completely powered-off phones produce no RF emissions
- Impossible to detect with spectrum analyzer
- Require physical inspection or other detection methods
Carrier aggregation and advanced modulation:
- Modern 5G phones use complex signal structures
- Carrier aggregation spreads signal across multiple bands
- Harder to distinguish from background noise
- Requires advanced analyzers and expertise
Dense RF environments:
- Urban areas with many legitimate RF sources
- WiFi, Bluetooth, broadcast stations, other phones
- Sorting target signals from background requires experience
- Baseline surveys become critical
Sporadic transmissions:
- Idle phones transmit infrequently
- May not transmit during scan window
- Requires extended monitoring (several minutes minimum)
- Real-time analysis helps but doesn’t guarantee detection
Spectrum analyzers provide powerful capabilities for detecting and analyzing cell phone RF transmissions. Proper configuration, understanding of cellular signal characteristics, and appropriate techniques for your specific application enable effective detection. Whether securing facilities, enforcing policies, or conducting technical investigations, spectrum analysis offers professional-grade tools for identifying cellular device activity. Combine technical knowledge with appropriate equipment and systematic procedures to achieve reliable cell phone detection results.